TRON (TRX) Remains Strong Above Key Support Level Despite Crypto Market Weakness
The cryptocurrency market has faced some pressure in recent days, with many digital assets experiencing price declines. However, TRON’s native cryptocurrency, TRX, has shown resilience by staying above an important support level. Even after pulling back from its recent high, TRX continues to hold key price zones that traders and investors are watching closely.
At the time of writing, TRX is trading near $0.3220 after reaching a recent high of around $0.361. Although the token has moved lower from its peak, market analysts believe that the overall upward trend remains intact. Buyers are still actively supporting the price, preventing a deeper decline.
Important Support Levels Keep TRX Stable
Technical analysts have identified a strong support area for TRX between $0.3305 and $0.3110. These levels are considered important because they often act as zones where buyers enter the market and help stop further price drops.
Many traders use Fibonacci retracement levels to identify potential support and resistance zones. According to this analysis, the 50% retracement level is located around $0.3301, while the 61.8% retracement level is near $0.3102. Another important level, the 78.6% retracement, sits around $0.2870.
As long as TRON (TRX) remains above these key levels, especially the $0.3110 support area, many analysts believe the cryptocurrency can continue its broader upward trend. The current price decline is being viewed as a normal correction rather than the beginning of a major downtrend.
Market experts suggest that pullbacks are common during strong upward trends. Such corrections often allow the market to cool down before another potential move higher. This is why many traders are paying close attention to the current support zone.
Elliott Wave Analysis Suggests Temporary Correction
Some analysts are using Elliott Wave theory to study TRX’s recent price action. According to this approach, the current decline appears to be a second-wave correction within a larger bullish trend.
In simple terms, this means that the market may be taking a short break after a strong upward move. If this analysis is correct, TRX could eventually resume its upward momentum once the correction is complete.
However, analysts also warn that a drop below $0.2870 could weaken the bullish outlook. If that happens, attention may shift to the next major support area around $0.271. For now, though, the market remains focused on whether the current support zone can continue to hold.
RSI Indicates Growing Buying Interest
Technical indicators are also showing signs that buyers may be returning to the market.
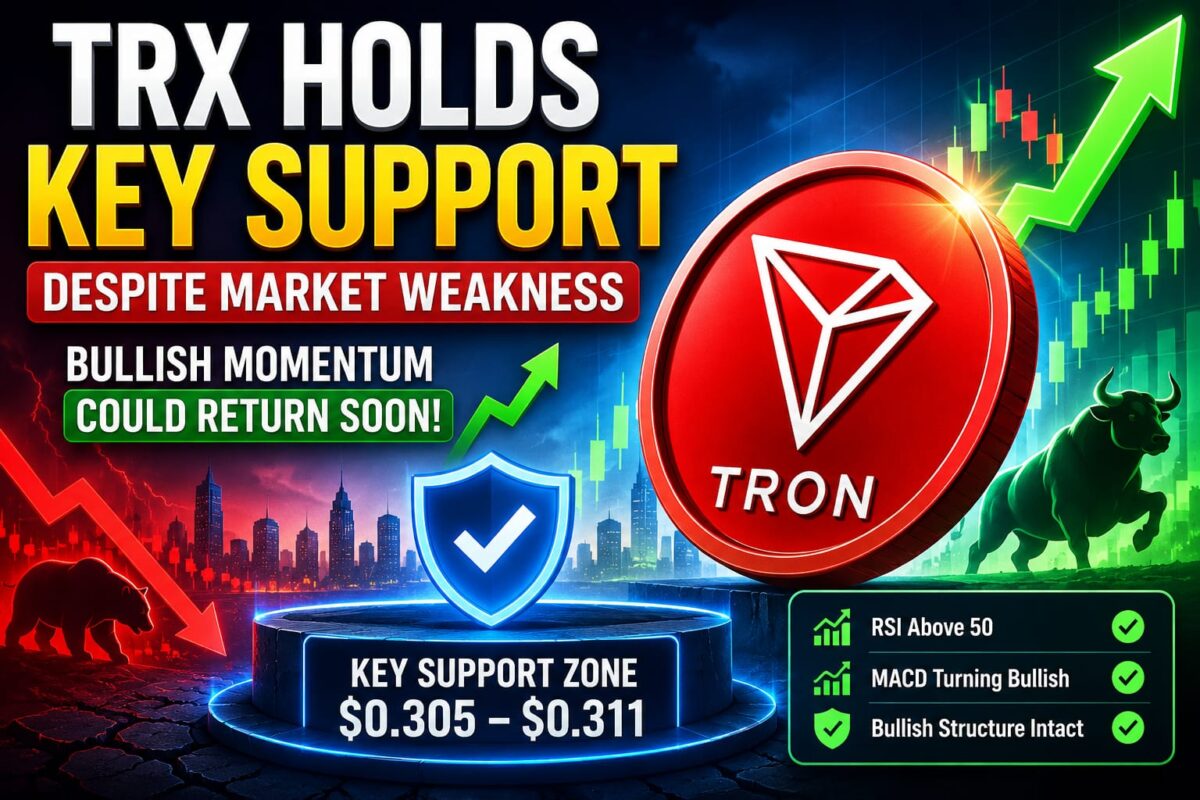
One of the most commonly used indicators is the Relative Strength Index (RSI), which measures buying and selling momentum. The current RSI reading for TRX stands at 51.26. This is slightly above the important 50 level, suggesting that buying pressure is beginning to increase.
The RSI moving above 50 is often considered a positive sign because it indicates that buyers are gaining more control compared to sellers. While this alone does not guarantee a price increase, it can be an early signal that market sentiment is improving.
Investors often monitor RSI closely because it helps identify potential trend changes before larger price movements occur.
MACD Signals Positive Momentum
Another popular technical indicator, the Moving Average Convergence Divergence (MACD), is also showing encouraging signs for TRX.
Currently, the MACD line has moved above its signal line, while the histogram remains in positive territory. These conditions are generally viewed as bullish signals because they suggest that downward pressure is weakening and momentum may be shifting back in favor of buyers.
Although the positive signals are still relatively modest, they indicate that the market could be preparing for another upward move if buying activity continues to strengthen.
Traders will continue to monitor both RSI and MACD in the coming days. Stronger readings from these indicators could increase confidence in the possibility of a fresh rally.
TRON Focuses on Industry Growth and Regulation
Beyond price movements, TRON has also been active in supporting broader blockchain industry development.
The project has highlighted the importance of cooperation between blockchain companies, policymakers, and regulators. Through its support of the Digital Sovereignty Alliance, TRON is encouraging discussions about the future of digital assets and the creation of clear regulatory frameworks.
The Digital Sovereignty Alliance works to improve communication between the blockchain industry and government policymakers. Its goal is to help create balanced regulations that support innovation while providing greater clarity for businesses and investors.
As one of the major blockchain ecosystems focused on digital payments and entertainment applications, TRON’s involvement reflects its commitment to responsible industry growth and regulatory transparency.
What Investors Are Watching Next
For now, the main focus remains on the important support level around $0.305 to $0.311. If TRX continues to hold above this area, analysts believe the chances of another upward move remain strong.
Technical indicators are beginning to show signs of recovery, and the overall market structure still favors a bullish outlook. However, traders will remain cautious as the cryptocurrency market continues to experience volatility.
The coming days will be important for TRX. A successful defense of key support levels could open the door for renewed buying interest and a potential move toward higher prices. On the other hand, a break below major support zones could lead to additional selling pressure.
For now, TRX remains one of the cryptocurrencies showing relative strength despite broader market weakness, keeping investors optimistic about its future performance.
Read More Ethereum Foundation Plans Major Budget Cut and Job Reductions to Secure Long-Term Future
Disclaimer:
The information provided is for informational and educational purposes only and should not be considered financial, investment, or legal advice. We do not guarantee the accuracy, completeness, or reliability of any information presented. Any financial decisions you make based on this content are at your own risk. Always conduct your own research and consult with a qualified financial advisor before making any investment decisions. Investing involves risk, and past performance is not indicative of future results. We are not responsible for any losses or damages resulting from your actions.